A while back, after using my Nordic PPK2 Power Profiler to gather power-usage data for the floater, I did some basic calculations to try and determine the theoretical battery lifespan.
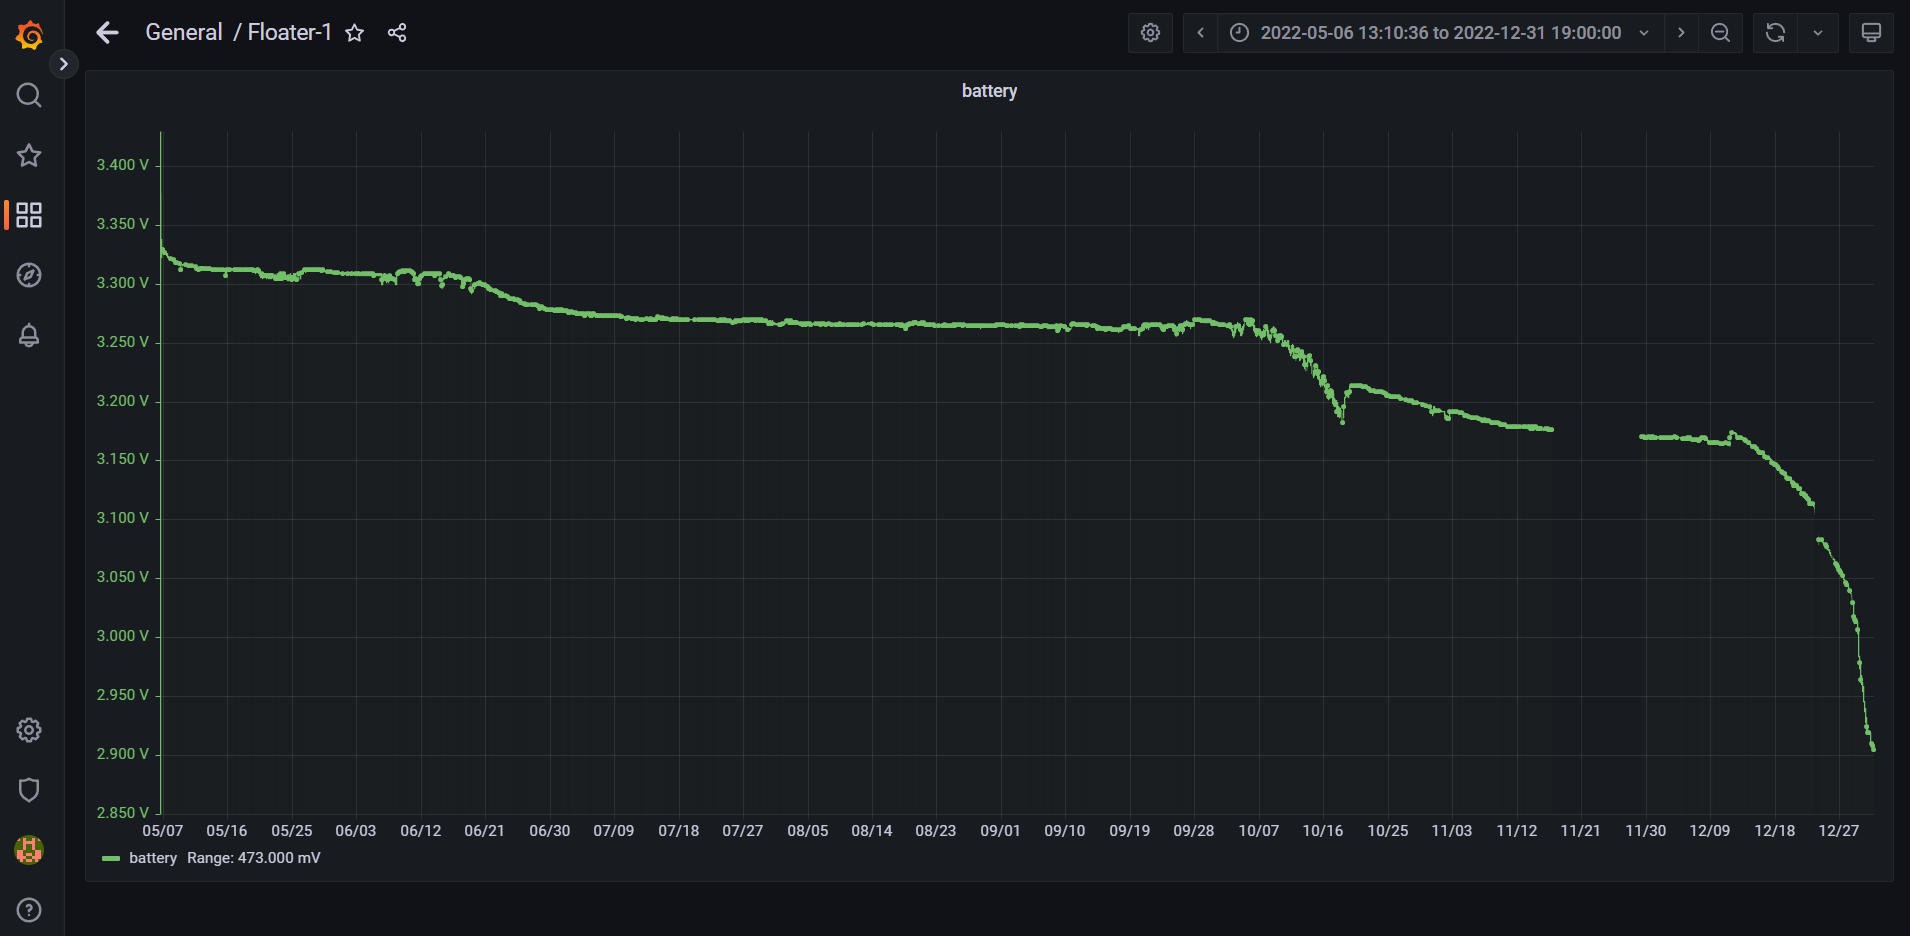
The test has been running for many months and finished on 31st Dec 2022. With the floater sending data every 5-min, my theoretical lifespan was 8 and-a-bit months. What was actually achieved was 7 months, 3 weeks, 5 days. Considering the events over the testing time, I’m pretty happy about the end result. It is a sample-size of one so not necessarily typical. It is what it is.
In that time I had WiFi dropouts, power-cuts, my Raspberry-pi that logs the data locked-up for over a week before I noticed, and the home router died and was replaced. The Raspberry-pi lockup did not affect the battery lifespan but the other stuff did so there was several periods of WiFi logon-timeouts for the floater. Considering all that, just under 8 months was a good result.
Device cut-off was 2.9V. Looking at the graph, its definitely over the edge of the discharge cliff so perhaps 3V would be better.
The shape of the discharge was unexpected. I have no explanation of the dip and recovery about 2/3 of the way through the test. There were no WiFi issues around that time. As the final steep decline starts, the router started to have issues and the ‘lift’ of the voltage was after a series of high-discharge events (WiFi timeouts). I’m speculating if the higher-than-normal discharges have an effect on the battery chemistry (the mobility of charge transfer). The normal discharging current pulses are short and infrequent. Maybe the higher (and more sustained) current pulses help things to move around more at a molecular level. Or I could be completely barking up the wrong tree and its a software glitch in my sampling/averaging routine. The reported voltage is the average of a run of 64 samples. The step-down a bit later is when the router died so a bunch of WiFi timeouts for the floater, till the replacement router was fitted. This happened after the knee of rapid voltage drop.
If anyone reading this knows more about the low level battery chemistry of LiFePo4 cells and how they behave, I’d be happy to hear from them 🙂
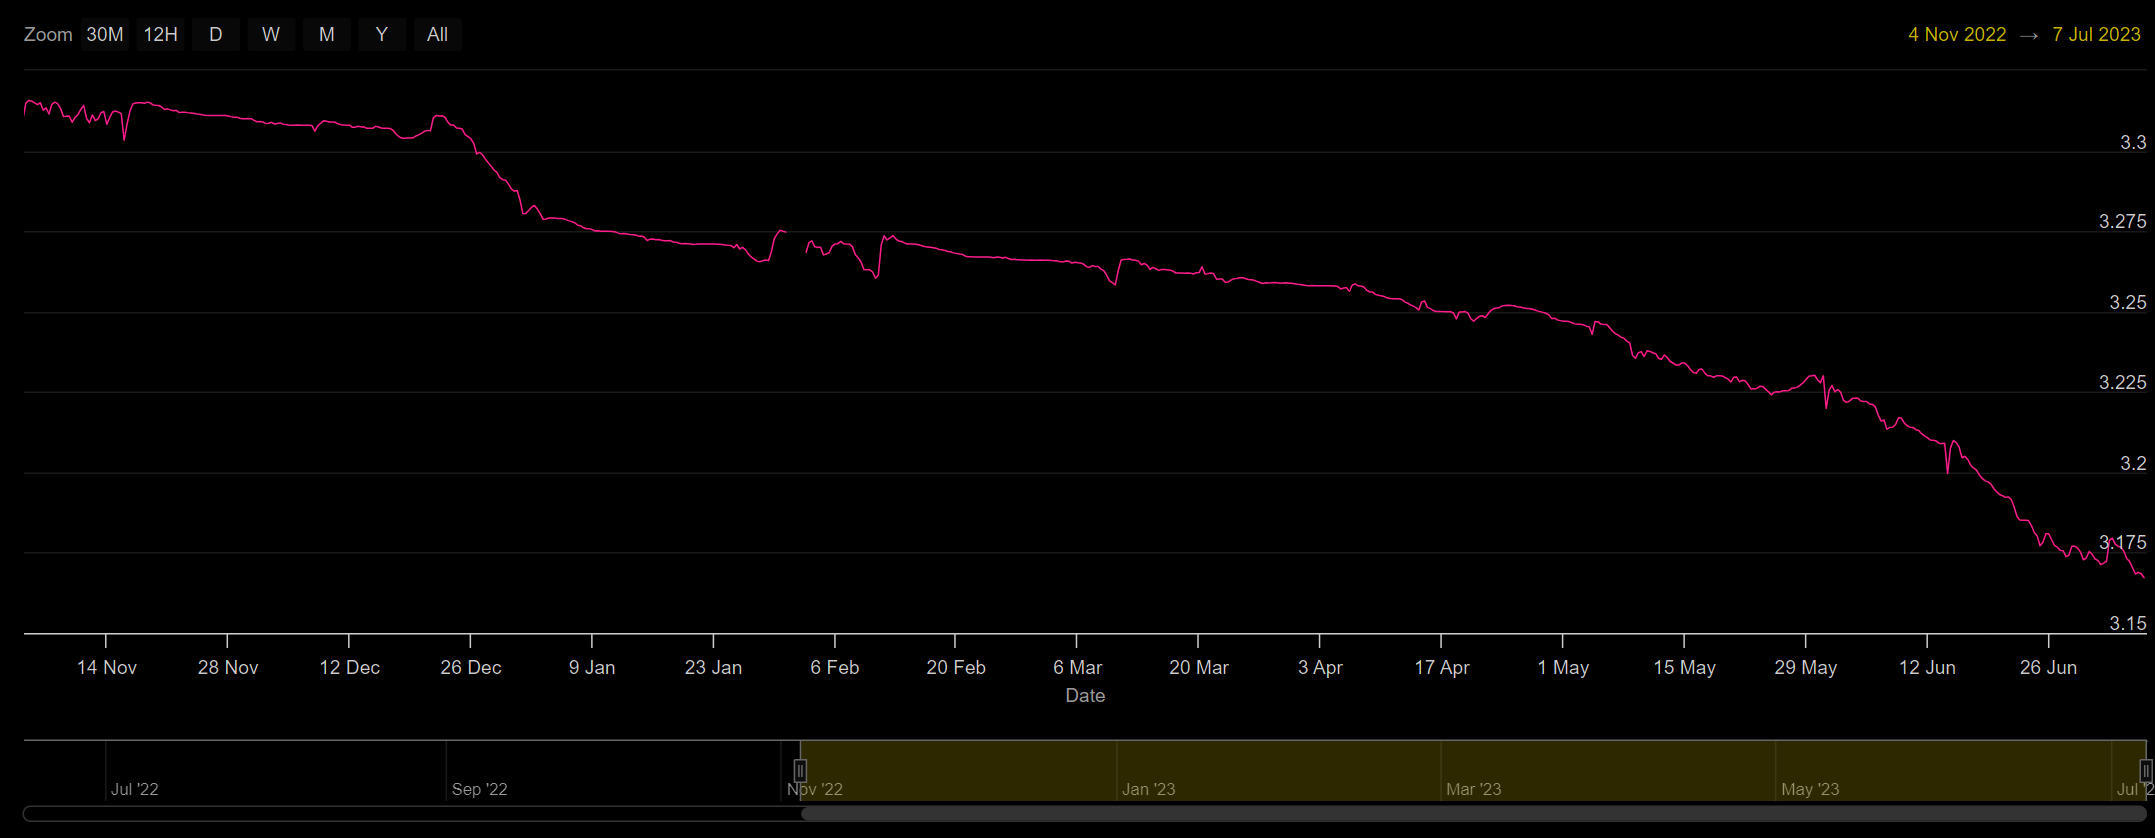
7-July-23 And another one.. This floater is inside a metal brewery keg, which is in a modified fridge (for temperature control). It uses a small repeater sitting on top of the keg because the loss going from inside two metal containers (keg + fridge) is too much, but from just inside the fridge is OK. The fridge is not so RF ‘sealed’ so easy to get the signal out. This has run for 8-months so far (4-Nov-22 to 7-Jul-23) and is down to ~3.16 volts so probably time to recharge as its just at the start of the final faster decline.
The WiFi environment was mostly good but the router was unplugged for an afternoon. All in all, a quite reasonable result. I don’t apply any temperature compensation to the ADC readings and this shows up as the sudden dips/peaks as the temperature swings by 20-degC (or more) during a cold-crash. The floater reporting rate was set to 5-min.
Below is a more technical explanation of the Floater. To see the ‘user-manual’ style page, its here
The physical electronics hardware consists of:
ESP12S module (WiFi connectivity and computing power)
ATtiny1614 (low-power companion processor)
DS18B20 (temperature sensor)
MPU6050 accelerometer module
Design targets for this were: Simple circuitry, easy to build at home, readily available parts, no APP required.
I’m not much of a fan of apps so I wanted to be able to do everything using a normal web-browser (setup and configuration).
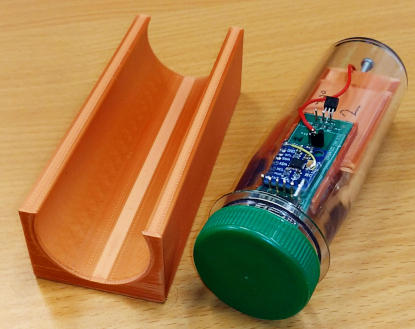
The electronic components are mounted on a small printed-circuit-board (PCB) that is in turn mounted on a 3D-printed 2-part carrier (see the user manual for pics).
The battery compartment is one part of the carrier and the actual circuit-board mount is the other. The two items are stuck together. This allows for some re-positioning of the PCB mount relative to the battery section for minor weight distribution adjustments.
The main balance adjustment for operational use is by the long screw at the lower (when deployed) end of the carrier.
If the screw is wound into the carrier body (made shorter), this lets the weight move down lower and so moves the tube more towards the vertical.
If the screw is wound out (made longer) the weight moves away from the bottom and so the tube end sits higher in the water, moving towards the horizontal.
This simple adjustment method allows for a surprisingly accurate angle adjustment. Once set, removing and replacing the carrier from the tube has little effect on the angle. The weight of the carrier & batteries always lets the carrier freely find its lowest point in the tube and rests the adjustment screw-head in the curved bottom. The adjustment screw is aligned on the tube axis so naturally sits in the lowest point on the curved end.
The device is powered by two 600mA-h LiFePo4 batteries (in parallel). This particular battery chemistry has advantages in 3.3V electronics.
For a conventional LiPo battery, when fully charged the voltage is a nominal 4.2V. This is too high to use directly for 3.3V electronics so a voltage regulator is required.
Voltage regulators have losses and inefficiencies. Even when the circuit is in low-power ‘sleep’ mode, the voltage regulator consumes power. It might not be a lot, but it adds up over time. These regulators also have a dropout voltage so if you feed it 4.2V in and the WiFi unit starts transmitting, the dropout could be 0.3~0.4V. It sounds like not-much, but it is significant. The high powered pulses used during WiFi transmission could cause the WiFi chip to lock up or reset if the voltage drop in the regulator becomes too much.
LiFePo4 cells have a lower fully-charged voltage. Most chargers consider them fully charged at 3.65V. If you sit them aside for a few hours, this relaxes to a comfortable 3.4-ish volts. These are fine to use directly without a regulator, so no parasitic ongoing drain or voltage drop that is associated with linear regulators.
Another type of regulator is a micropower switching regulator. Some of these are very good now in terms of efficiency but the physical size and style of the actual components make them very unfriendly for DIY home use. It also adds to the component-count and takes up space on the PCB.
I opted for simplicity and low component count. Ease of manufacture.
The electronic components are able to use almost the complete voltage range (charged to discharged) of LiFePo4 batteries.
The low-voltage cut-off I choose is 2.9V (not a full discharge). 2.5V seems to be a common figure for fully discharged but if they are discharged less, they last longer (in terms of charge cycles). Greater than 800 charge-cycles is realistic. That’s a lot of beer!
So what makes this different from other similar offerings?
Others try to do everything in the one device. As far as I understand, they communicate directly to perhaps an online logging site, or a brew-site with logging. They use internet friendly network protocols (TCP/IP) with assured data packet delivery. They are designed to directly communicate over the internet.
The duration of a ‘wake-up and send data’ transaction (start to end) can be multiple seconds. Its very dependant on external conditions on the internet and the site you are sending the data to. If you want to send data to more than one place then the wake time extends to suit. The timing can be fairly fluid, and long.
Direct internet communication can certainly be very useful but there is a power-consumption penalty to pay for the convenience.
This one (the Floater) is more of a ‘component’ in a system.
It uses UDP broadcasts to send its data. The data is ONLY available in the local network. UDP Broadcast packets are not passed-out to the internet by your home router. It is still easy to log stuff to the internet though.. (more on this later).
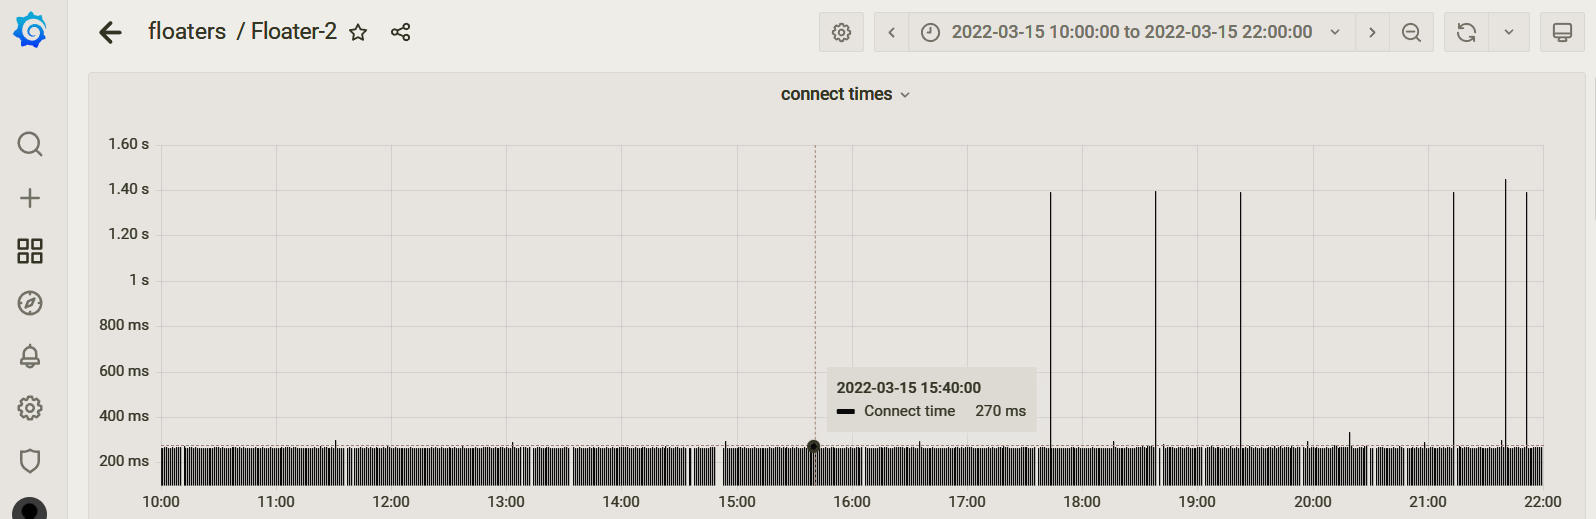
UDP is fast. The typical complete duration of a Floater ‘wake, get data, send, back to sleep’ is 265~280ms on my very ordinary home network.
This is a typical 12-hour slice of floater wake-to-sleep times. The time stated above is from a reset-pulse (to wake the ESP8266), to the ESP going back to deep-sleep.
Most of the connections are 265~280ms. Now and again a longer one appears, probably due to short term WiFi congestion. Also there is occasional gaps with missing packets.
Using UDP has pros and cons…
PRO’s:
Its very fast, minimal data overhead. Basically send-and-forget. No receive function used.
UDP broadcast packets.
CONS:
No assured data delivery (so occasional lost packets).
Not able to directly log/send data to the internet.
So are lost packets actually a problem?… In real use, no.
The floaters are tracking a change in SG that happens over 1~2 weeks so the now-and-again lost packet becomes pretty much irrelevant. If you HAVE to get every transmitted packet, this may not be the device for you.
If you set the reporting rate to 60-min, 3 lost packets in a row would leave a bit of a gap, so not great. Still not actually going to stop you seeing the curve though.
The simple workaround is to increase the report rate. If set to 10-min then a bunch of lost packets would be pretty invisible over 2 weeks.
When set to 5-min and used on a non congested network (so mostly fast connects like above) the projected battery life is about 7~8-months continuous running. At the time of writing this, I have not run one for that long yet. (See the POWER USE section below…)
Most network/wifi transactions have a source and a destination. Its the backbone of the internet. If the data packets did not have a ‘source/destination’ attached to them, you would not be able to receive web-pages, get you email or use most of the WWW functions we take for granted.
Broadcast packets have a source but no destination.
Perhaps another way to phrase it is everywhere on the local network is the destination. Your home network has lots of broadcast packets floating around on it. The functionality is used widely for certain computer-network background operations.
The underlying (individual device) software that runs network operations usually allows devices on a network to accept broadcast packets. The receiving machine (everything on the local network!) looks at the data packet and checks it for a ‘port’ number. If the receiving machine happens to be expecting data (listening) on the particular port number, it accepts the data packet and passes it in to the relevant software module. If it is not expecting anything with the packet’s port number, the data is simply/silently discarded.
So the data packets transmitted from the floater go to everything on your local network at whatever rate you have configured it for (1 to 60-min). Its not a big deal, occasional data packets, not a flood of data.
Almost everything just discards the data. Only network devices set to ‘listen’ on the particular port number actually take it in.
This is pretty useful.
It means multiple devices can listen to, and then use the data for separate reasons, at the same time.
An ESP01 device can read the broadcast packets then post the data to the internet in the format of your choice. Because its removed from the sensor, it no longer matters if its a slow process.
A Raspberry-pi can ingest the packets directly into InfluxDB then display with Grafana. Good for long-term data capture and review (I use this a lot).
A temperature/angle display can be constructed as a stand-alone indicator where you can conveniently view it.
Temperature can be extracted and used as part of your process control (and/or angle).
Once the data is on your local network it can be used in multiple ways. Distributed functionality or perhaps a central controller. Both options are viable.
You are able to get a good feel of how your network is behaving by looking at the connection times (Uptime) and lost packets. Every packet is numbered. From power-on it starts at 1 so you can track how many gaps you get in the count.
Each floater has a unique ID number in its data packet so your not restricted to 1 or 2 or 3 units. There will probably be a maximum number you should use in a small area, but 20~30 or more, reporting at 10-min intervals doesn’t seem unrealistic. It would make sense to dedicate a WiFi network to the floaters for a larger installation.
Packet structure:
Floater data packets are sent as plain text in InfluxDB line-format. This is what a packet looks like…
BBfloater,loc=6 This is the floater ID. Its a BrewBoss floater, number-6. The number is on the floater carrier
X=-558,Y=129,Z=16545 Sensor axis values
T=24.0625 Temperature
V=3.292 Battery voltage
XD=-1.92,YD=0.46 Roll and Tilt values (in degrees)
N=1340 Packet count since powered-on
UT=265 Uptime for this packet (in ms). From reset (to wake ESP), till back to sleep
AX=-554,AY=13,AZ=16525 X/Y/Z axis rolling average of the configured number of samples (2 to 20)
R=1 Run indicator. The last group of packets that get sent before a low battery shut-down have R=0
One of the reasons the Floater is so efficient is because some of the required processing is offloaded to a low power companion processor.
The ESP8266 is more than capable of doing all the processing but the downside of that is it uses a lot of battery power. Keeping the ESP in deep sleep for as long as possible is good!
Since the ESP is only awake for (usually) less than 300ms, it can not use the temperature sensor. A full resolution temperature reading takes about 750ms so this is achieved by the companion processor waking up, initiating the temperature conversion, going back to sleep for 1-sec, waking again and reading the temperature result.
The companion processor (an ATtiny1614) is actually the overall controller for the Floater. It is responsible for timekeeping, running the accelerometer and reading the temperature.
For a reporting rate of 1-min, a simplified timeline is…
At 59-sec, ATtiny wakes up, starts temperature conversion, wakes up the accelerometer and starts it running, Attiny goes back to sleep for 1-sec.
Attiny wakes up, reads temperature result, reads X/Y/Z axis data, reads the battery voltage, shuts down the accelerometer, sends reset pulse to wake up ESP then waits while ESP boots up.
When ESP flags its ready, ATtiny sends its collected data to the ESP then goes back to sleep for the configured report-rate (-1 sec). ATtiny’s job is done for this cycle.
ESP is waiting for WiFi connection, while waiting it repackages and formats the data, creates the data packet, still waiting… (if times-out, go back to deep-sleep)
WiFi connects, ESP sends UDP broadcast packet then shuts down into deep-sleep mode.
That completes the cycle. ESP is only active for (typically) 265~280ms.
Power use:
This is a power-consumption graph of an ESP wake-up event (captured using a Nordic PPK2 power profiler).
The grey area starts with the ESP being woken by the ATtiny. It finishes when the ESP goes back to deep-sleep.
The ESP boot process hands over to the user sketch at the start of the first high current peak. At the bottom of the picture, the blue horizontal line rises at the sketch start and falls when WiFi is actually connected. The very last high current peak is the UDP data packet being sent..
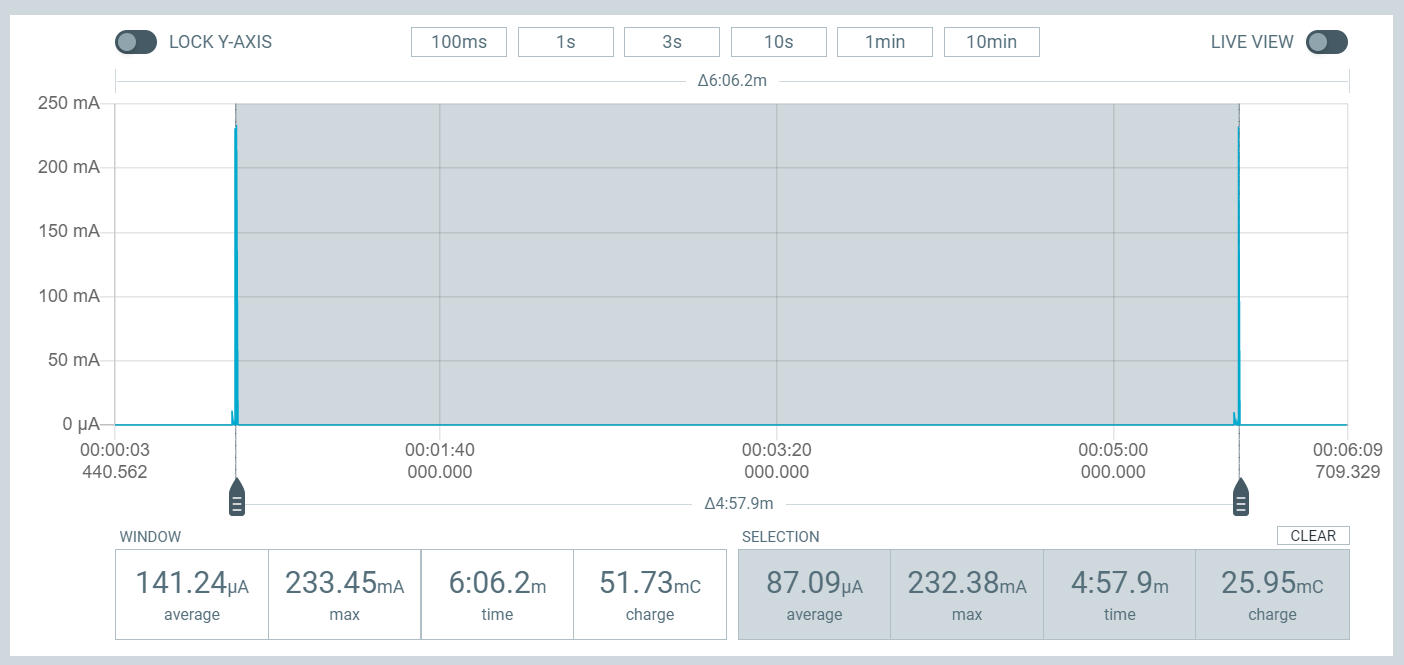
A full 5-min cycle…
The power profiler shows the actual charge used for the 5-min cycle so this makes it fairly easy to calculate how long the battery should last.
Charge used is 25.95 milli-Coulombs for the 5 min cycle.
To convert this to mA-h, simply divide by 3.6 so 0.02595/3.6 = 0.007208 mA-h.
So 1 hour uses 0.007208 mA-h x 12 = 0.086496 mA-h
1 day is 2.075904 mA-h
30-days = 62.277 mA-h
Now the bit that gets missed….
Batteries have a self-discharge rate. For these (same as LiPo’s) about 5% a month. Battery capacity is 1200mA-h so 5% is 60mA-h that just vanishes. The self discharge is almost the same as the actual power consumption!
Also, the batteries are not fully discharged in use, only by about 85%. This gives a useable capacity of 1020mA-h
So monthly useage is 62.277 for the electronics and 60 for self discharge so 122.277mA-h
1020/122.277 = 8.3 months.
The assumption here is that all wake-events are the same as above. This is obviously not going to be the case. Some will be more, some less but the battery life figure should be a reasonable approximation for real life use. It is calculated from real observed data.
A poor network environment could substantially reduce this figure so good WiFi is the main key factor for long battery life.
On WiFi quality, this is what happens to battery voltage when the WiFi dies for 22-min..
A few lost packets noticeable (the small gaps in the lines) but this is not too unusual.
Then the WiFi goes off.
What the floater tries to do is still connect to a now non-existent WiFi network so each time it tries, it times-out. This wait-time is set when you configure the floater. Between 2 and 4 sec is a reasonable number. You could set it lower but the price is more missing packets. This setting is network-condition dependant. I mostly use 2500ms.
The repeated timeouts, 22 of them, (periods of higher power draw) causes the battery voltage to droop slightly (by 18mV) but when the WiFi returns you can see the battery recovers to just 4mv below where it started. If the battery is near the end of its working voltage, the droop can be larger and so cause premature shut-down due to low battery voltage.
If its only a small number of fails, the battery voltage droops less (if at-all) and usually rises back up to the original value. After higher rate discharge events, voltage can continue to creep back up for hours.
If your WiFi was off for a day it will have a substantial impact on the battery charge state. (note to self, try it!)
Internet logging:
So how do you get this data to the internet?
Consider a setup where the Floater reports every 5-min. This is probably overkill for reporting to an internet logging service.
Because the broadcast packets are zipping around on your WiFi, it’s fairly trivial to receive this data on another ESP8266 module. An ESP01 is fine for this, or a WeMos mini. I’ll call this device a Logger.
What I do is when a data packet arrives is: I save all the variables and assign a lifespan to the group. Every time new data arrives, it overwrites the last lot and the lifespan is reset. As part of my loop, I check if the data lifespan has expired and set flags appropriately.
If I’m logging to the internet every 30-min, when the logging time comes round, I check the data store and if its lifespan has not expired, use it to post to the internet.
As well as basic logging, the Logger can perform other calculations on the data. The obvious one being angle to SG.
Since its pretty simple to set the reference-angle to within 1-deg I’m hoping (not tried yet) that it can be done with a fixed table, rather than having to mess about with spreadsheets and equations. So far, I just look at angle to see when fermentation has stopped. I’m not that bothered about what the SG actually is. Its not like I’m not going to drink it because I dont know the figure (unless it tastes really bad!)
But for the sake of completeness, I’ve added it to my list of ‘things to do’.
This is a single wake from deep-sleep event in the Arduino environment.
Reset pin is pulsed, ESP wakes up, collects data, WiFi connects, sends data by UDP, then back to deep-sleep.
The greyed area starts with the ESP reset pin being activated and ends when the ESP goes back to sleep, in this case (above pic) it takes about 280ms so it is not completely unrealistic to use ESP8266 devices on batteries (many people do). Between 269 and 274ms is fairly typical for me on my home network. Here is 12-hours of connect-times graph The times are NOT by using millis() as the internal timebase does not start till some time after the reset.
The low-power item before the ESP-reset is a companion-processor (ATtiny1614) that does a bunch of background stuff. It is responsible for waking the ESP and handing over its collected data for transmission. It also handles the DS18B20 for temperature because the ESP is not awake for long enough.
At the bottom of the image, the blue logic trace is the actual Arduino sketch-active time. 1st instruction in sketch sets it high, goes low after initiating the UDP transmission.
There is no RF-Cal on wake so startup is quicker. In my use, every 100th wake, an RF-cal is included.
From reset to start of sketch is (in this case) 113ms. This is dead-time for the user while the ESP is initialised up to the point where the boot process hands over to the user sketch. WiFi becomes connected just after the second-last current peak, so from sketch start to that point, do stuff!
By the time your WiFi connection is active your data should be all packaged-up and ready to send. There is about 160ms of actual usable sketch time available before WiFi is connected. Use it wisely!
With everything sleeping (ESP8266 and ATtiny1614) the standby current is about 78uA. Still a bit high. Now I have my Nordic PPK2 I can try and optimise this so as I modify the software I can actually see the difference.
11-Feb-22: After a bit of tweaking, standby is now down to 22uA. Not bad for an ESP and ATtiny together (and support circuitry).
Since getting my hands on a Nordic PPK2 (power profiler) I have been able to accurately measure the operational and standby/sleep performance of my ESP8266 systems that use batteries. One of my boards I’ve investigated contains the following: 1 x ESP12S 1 x ATTINY1614 1 x MPU6050 module 1 x DS18B20 plus a few capacitors and resistors. This is powered from 2 x 600mAh LiFePo4 cells in parallel.
The board is set up to wake up every 5-min, send data, go back to deep-sleep. I like to use the ESP12S in compact designs because it requires no external resistors. The relevant pull-up/down resistors are built in to the module so if its been programmed, all you need is to supply power (and a VCC decoupling cap). The MPU6050 module is a common version found on ebay. It has a small regulator (5V to 3.3V), a few caps and resistors and a power LED. To minimise the power consumption I remove both the power LED and the regulator from the MPU6050 module. Not using a regulator avoids the parasitic drain or voltage drop that would normally be involved.
The charge/discharge voltage profile for this type of cell means that no regulator is required for the electronics.
From the ESP data sheet, operating voltage is from 2.5 to 3.6V. MPU data says 2.375 to 3.46 ATtiny is 1.8V to 5.5V
By using the Nordic power profiler I obtained the following data for a 5-min wake/sleep cycle
The highlighted grey-section contains a complete 5-min cycle (well.., 4:57.9). (For an actual wakeup event, see here)
This shows max current (when the ESP transmits), average current and the charge used. (25.95 milli-Coulombs) To translate Coulombs to mA/h is a simple divide by 3.6 which produces 0.00720833mAh for the 5-min cycle. So 1 hour takes that figure up to 0.0865mAh, 1 day is 2.076mAh, 30 days uses 62.28mAh. Theoretically with 1200mAh of battery this allows for 13872 hours of operation. Or 578 days (19.2 months!). Mmm… was not expecting that. Seems a bit optimistic, maybe got my sums wrong somewhere. But even if its correct, its never going to be that good. Not even close.
This battery chemistry has a self-discharge rate of around 5% a month. Some sources say 3% but 5% seems the most common figure so lets go with 5%. This equates to 60mAh a month just vanishing. Nothing you can do about it. The electronics actually uses 62.28mAh/month and the battery looses another 60 in self-discharge. This brings the new monthly ‘consumption’ figure to 122.28mAh so the theoretical run-time changes from 19.2 months to 9.8 months. But wait, there’s more!
The battery capacity figures given by manufacturers are from full charged to fully discharged. If you read lots of stuff about LiFePo4 batteries, charging/discharging, what constitutes fully charged seems to vary. Some advocate charging as high as 4.2V which packs in an extra percent, others say fully charged is 3.65V (seems to be common). If you charge to 3.65V then stop, take it out the charger and next day measure the voltage it has settled to a more friendly (for my purposes) 3.4-ish V. (Some very good info about charge voltages and percentage capacity at powerstream) The minimum voltage for LiFePo4 cells is often given as 2.5V. I don’t let mine get that far down. I shut-down at 2.9V which probably looses maybe 8% of the available capacity so the 1200mAh battery is actually 1200-8% so 1104. Only charging to 3.4V can loose another 3%, so instead of 1200-8%, make that 1200-11% so now only 1068mAh
At last the numbers should be usable. 1068mAh/122.28 = 8.7 months which I’m hoping is a bit more realistic. Disappointingly different from the first number of 19.2 months (I’d got a bit excited!) but after thinking about it a bit, and reading more, I realised it just was not going to be. Theoretical-maximum and realism can be very different.
The style of usage has quite an effect on the usable capacity. If I was discharging at 0.5C then I should get close to the theoretical capacity as the self-discharge is not a factor. By using low discharge rates over a long period, the self-discharge of the battery becomes very significant. In my case, almost half the energy is lost in self-discharge. I have not managed to find any information about LiFePo4 cell very low discharge rates. 0.1C was the lowest test discharge I found. Although I’m not sure if this qualifies as low, perhaps pulsed is a better description. It does have high current pulses (~230mA), but of very short duration and 5-min apart to allow for ‘recovery’. It probably makes a difference and in a beneficial way to the user but I’m just guessing here.
Since the self-discharge has such a large effect on my battery life I looked at using 2 AA alkaline cells in series, no regulator. So lets look at some numbers here..
Capacity of a AA alkaline cell seems to be from 1700 to 2850mAh depending on the manufacturer so 2000mAh seems reasonable to use. Self discharge for alkaline cells is 2-3% a year, so 3%/12 gives 0.25% per month, or 5mAh per month loss. The ESP8266 needs 2.5V minimum so each cell only gets down to 1.25V which means only about 35% of its 2000mAh is available for use, so 700mAh Monthly use is 62.28mAh for the electronics plus 5mAh self discharge = 67.28mAh 700mAh/67.28 = 10.4 months. An extra 1.7 months than the rechargeable cells and starting with a lower available mAh. The self-discharge makes the difference.
Its not quite that simple. The circuit would need more capacitance because as the internal resistance in the cells rises (as its discharged), the high current peaks for the ESP transmission need the energy reservoir of the caps to source it. (Excellent article here with measurements and examples) There is also a degree of waste involved. The AA batteries still have 65% charge left. Maybe OK for a TV remote? The rechargeables are, well, rechargeable. 1000 charge cycles for the LiFePo4 batteries seems quite reasonable, but the alkaline cells probably go in the bin. Or modify the circuit to have a very efficient micropower boost regulator so much more energy can be extracted from the alkaline cells. I have not looked into this, I’m going for low component count and simplicity. Ease of building at home.
The figures above (apart from the actual measurements) are gathered (and interpreted) from the dreaded internet so don’t take it all as rigorously defined. It should however be ball-park enough to be useful and food for thought.
So how long would a simple configuration last running on batteries…
Only one way to find out.
The circuit is very basic. An ESP12 module on a carrier, the required pull up/down resistors, and a HTU21D humidity/temperature sensor. Power source is 2 alkaline C-cells. No regulator, just powered direct from the batteries.
The two C-cells measured about 3.15V to start and the ESP data sheet says it runs down to 2.5V. Data is read from the sensor every 3-min then posted by UDP packet to a local Influx-DB on a Raspberry-Pi. UDP because its fast and the occasional lost packet is not an issue for this function.
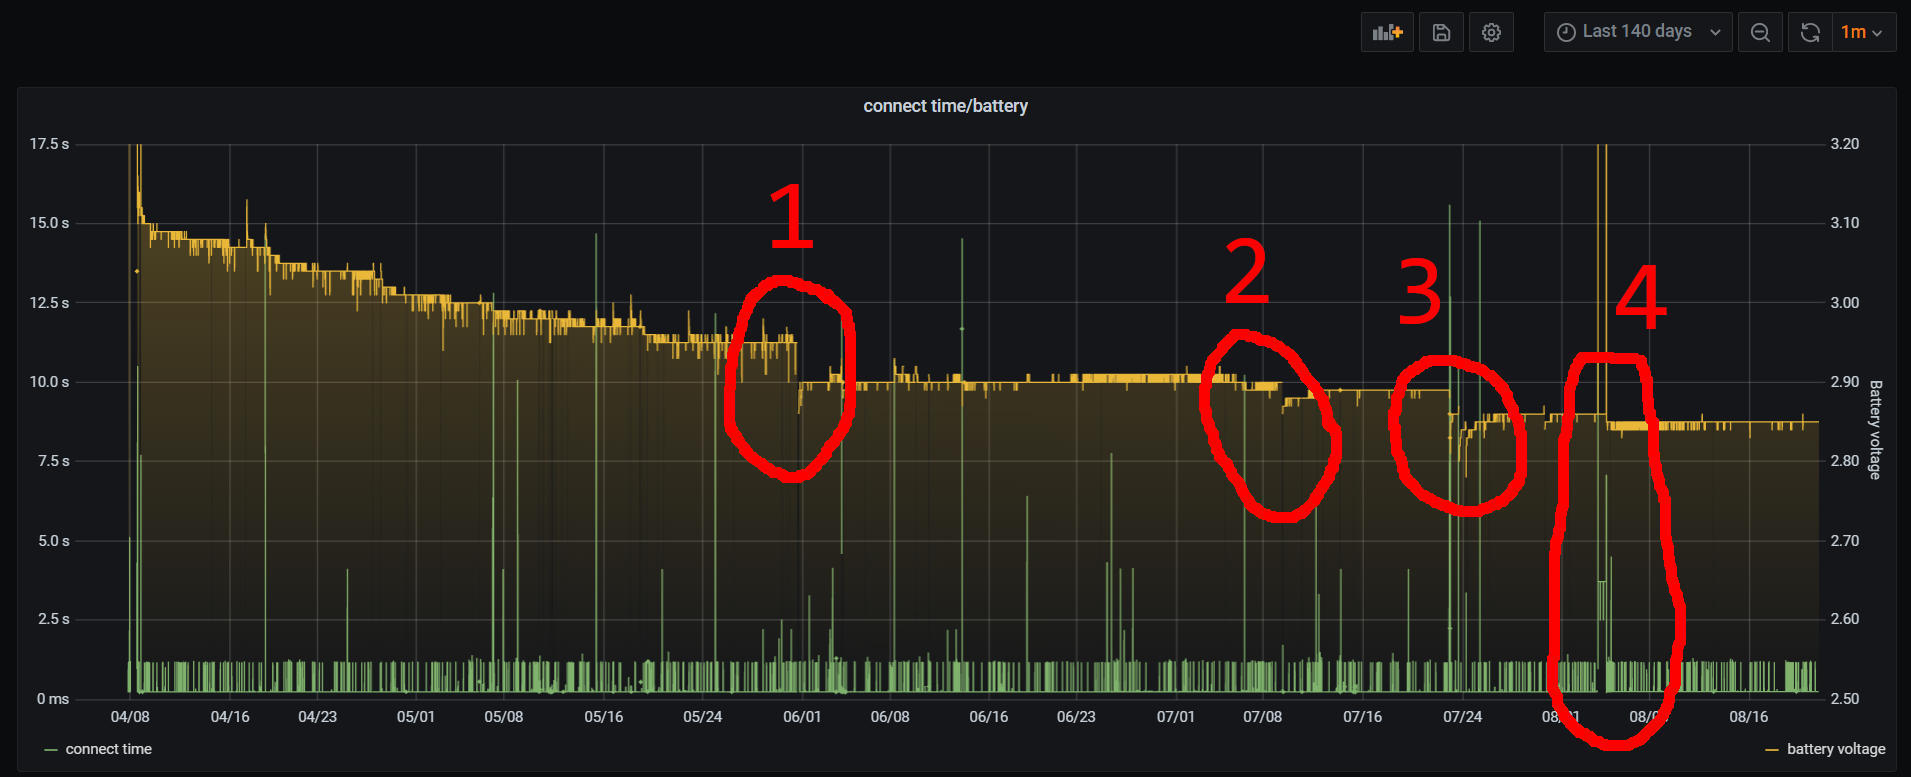
This is the 1st (nearly) 6-months.
The steps at 1,2,3 were because when the ESP wakes up from sleep and tries to connect, on these occasions the local WiFi was missing so instead of just going back to sleep, it kept trying to connect. This had a significant impact on the battery. I found it interesting that after the battery takes a bigger discharge-hit, it recovers somewhat in the time after. This can be over several days or a week or more.
4 was when i decided to tweak the software and fix the constant-retries issue but then I discovered that a breaking-change happened when I upgraded from ESP (arduino) 2.74 to 3.02.
Now WiFi defaults to WiFi OFF at the start of a sketch so every connect takes longer. Another battery-hit from that one! Till I found the fix to change behaviour back to the old-method of WiFi ON at startup.
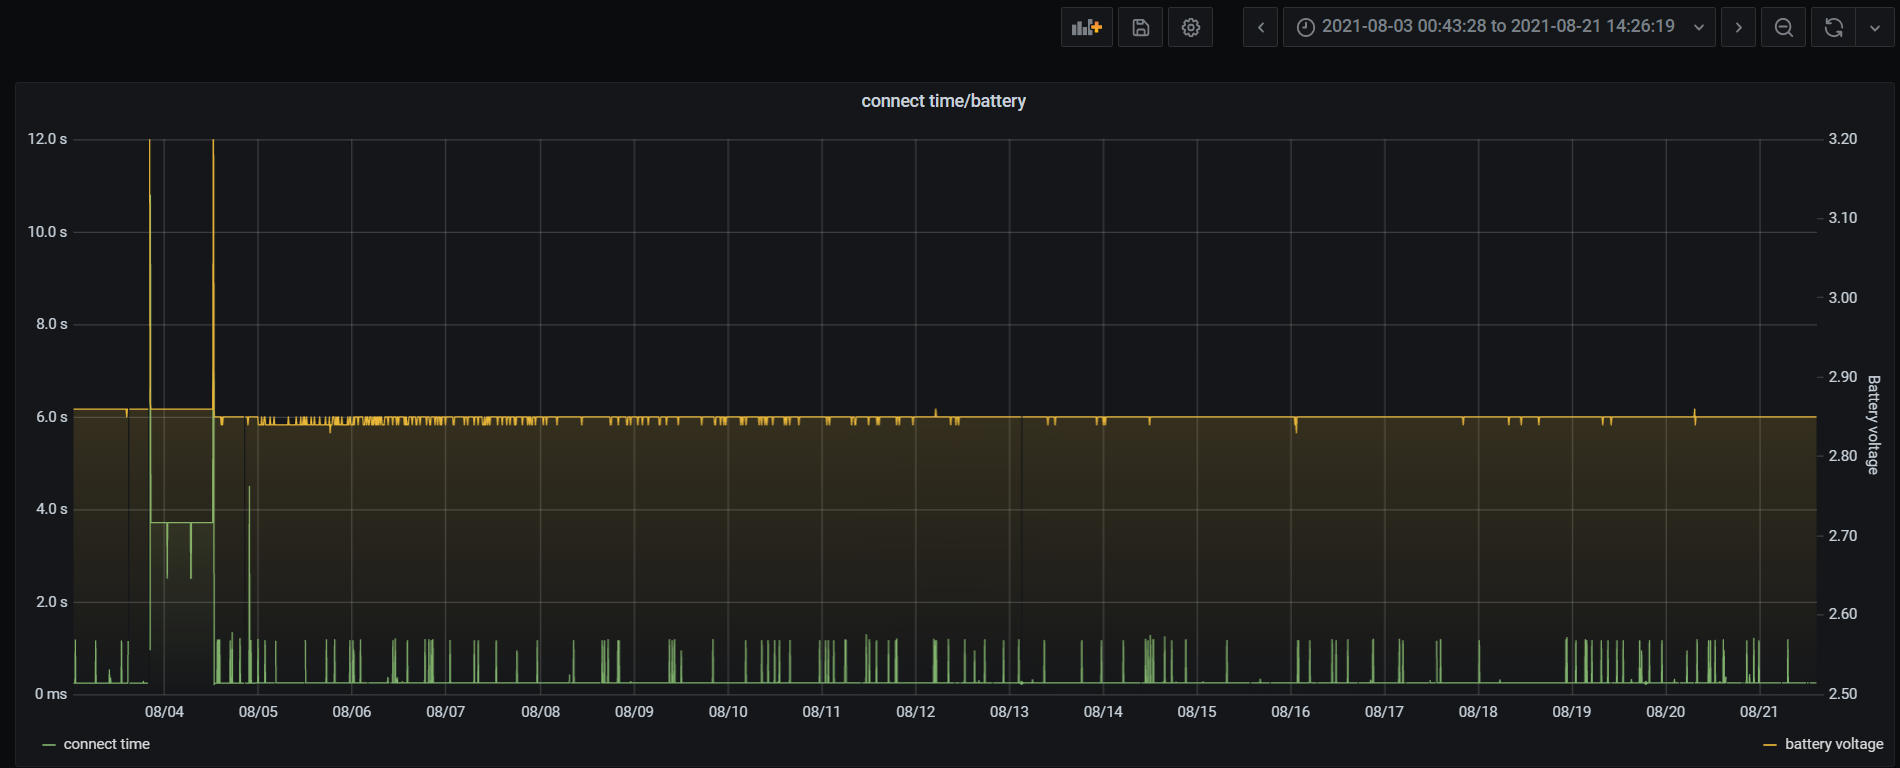
The green spikes are WiFi connect time. These vary considerably. This is a closer view of number 4 above.
Some connect times (in the early days) are over 10-sec which is a terrible waste of battery power. This is now changed so if no connection by 2.5-sec, it just goes back to sleep. No more retries if it fails (1,2,3 above), it now just shuts-down and tries again later. 2.5-sec is probably still too high as the green spikes for connect times are about 1.2-sec. It looks like if its not connected by 1.5-sec then its not going to happen is a sensible timescale.
This is 24hrs at the head of the graph. Almost all of the connect times are 253ms. This is slightly longer after the V3.02 changes. 247ms was the V2.74 baseline. Sometimes a 1.2-sec connection but the vast majority are pretty fast. Some gaps due to missing packets which could be because its UDP (and not a great environment), or possibly >2.5-sec WiFi timeouts. The time is measured from when millis() starts counting (prior to the user sketch beginning) till just before the UDP post.
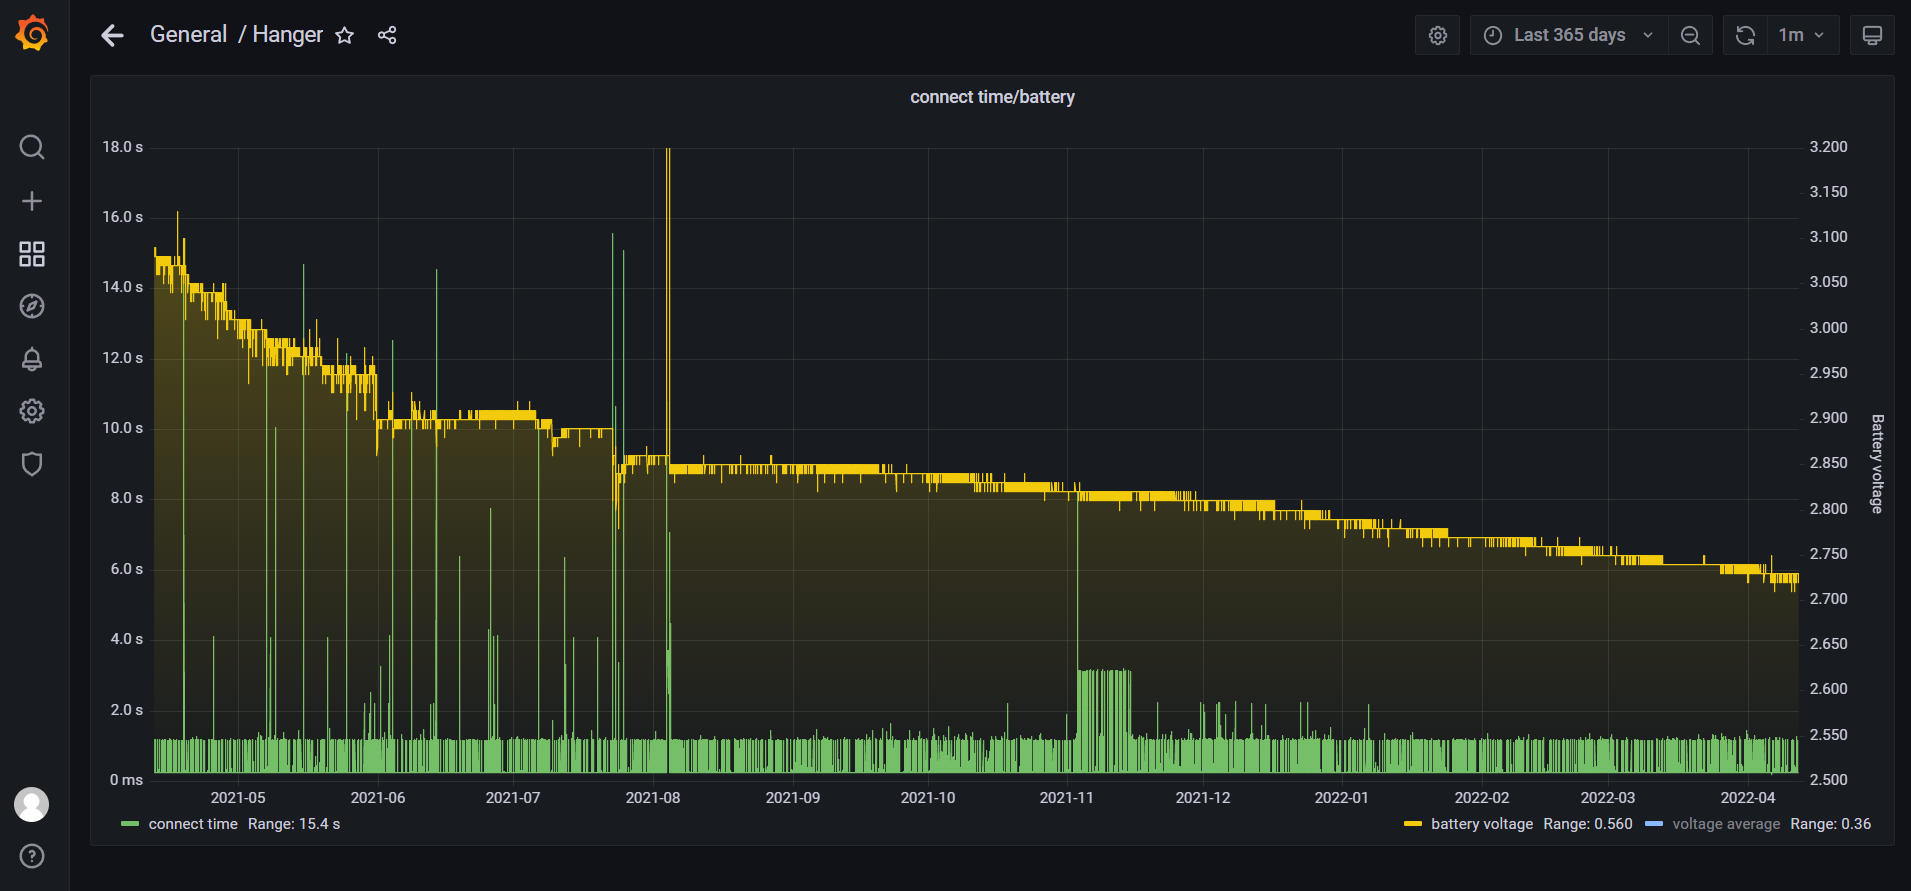
Now the constant-retries has been fixed, and the attempt-connect time reduced to 2.5-sec it seems believable that I might get a year from this set of batteries. Battery voltage is now down to 2.85V from the starting 3.15V.
The early discharge rate was quite steep due to a combination of software (constant retries) and the initial discharge behaviour of the batteries but this has flattened out now. The major step (1) in the first graph probably lost a month or more of runtime.
Apart from my dodgy software, its doing a lot better than I thought it would. Running a WiFi sensor from batteries had never seemed that practical to me but it looks like it is more realistic than I had initially thought. Maybe it will manage a year, maybe not. Time will tell.